


By Thomas Gruenberger
Key differentiation criteria for Additive Manufacturing (AM) technologies are freedom of design, cost advantage, customization, and time to market.
Direct metal laser sintering (DMLS) AM technology is ideal for serial production for industries like aerospace.
Setting up a process means mapping the input parameters (e.g. machine and process parameters and part geometry) to output parameters (part properties like density, tightness, surface quality). An in-situ non–destructive measurement of part properties like density is not possible, so indirect measurements have to be performed. Information from the process – process emissions, melt pool size, melt pool dynamics, and temperature distribution – can be used for this indirect measurement enabling the user to find a correlation between features of these measurements and the resulting part properties. Additionally, a shorter process development time can be achieved by avoiding destructive tests during development learning reading the extracted features (see Fig. 1).
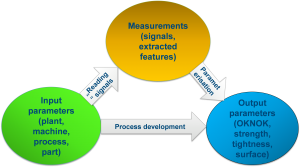
Fig. 1: Quality inspection – the challenge
As mentioned above, several pieces of information from the process can be used for the detection of irregularities, so different sensor technologies can be used. Consider a manual in-situ inspection of the process, where the user looks at the visible process emissions in the process chamber. Differences in brightness, size, color, and number of sparkles can be detected with the human eye. This can be automated using photodiode based meltpool monitoring systems like the plasmo fast process observer, a hardware developed by plasmo with up to 4 channels at sampling rates up to 300kHz.
So the system measures the brightness of the process emissions over time (blue curve in Fig. 2), using CAD data, the data can be mapped easily to an image of brightness of process emissions over the building platform (see Fig. 2 right plot), layer for layer, in pseudo color representation.
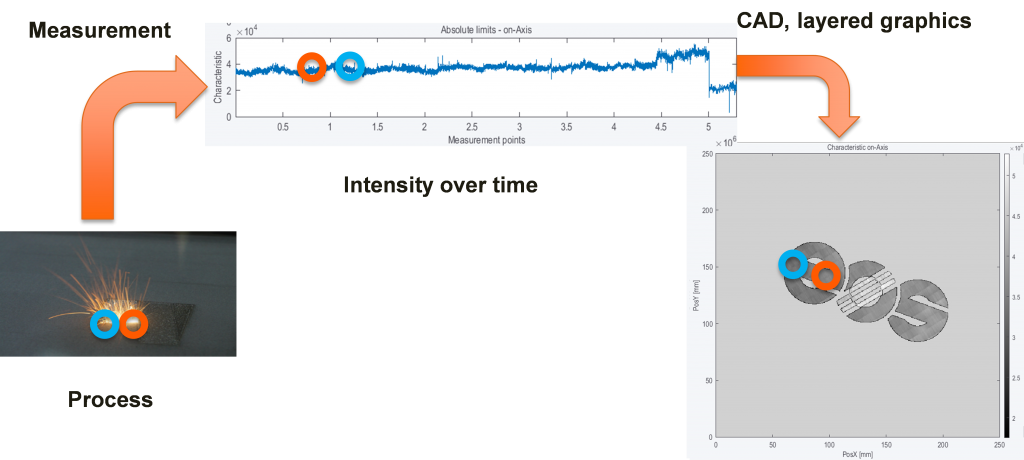
Fig. 2: Feature map of the building process
Running an OK process gives the baseline of the feature, provoking process irregularities yields in a change of the feature, enabling the user to set limits for the feature according to its quality needs. A pseudo color representation of a map of process irregularities can be calculated, giving the user an easy way to understand visualization and therefore, fast feedback about the quality of the process. As a note, black means no process irregularities and yellow means 100 percent of process irregularities in the given pixel in Fig. 3.
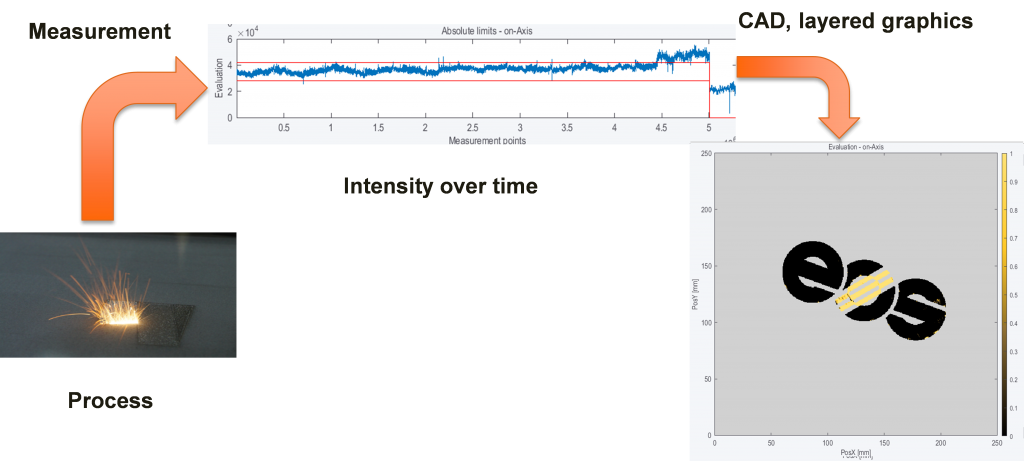
Fig. 3: Map of process irregularities
The fully automated measurement system enables a 100 percent inspection of the building process. The high sampling rate (ca. 10,000 times fa
ster compared to the human eye) enables the system not only to calculate features like signal height but the additional analysis in time, frequency and time scale domain can be performed, too. Three (3) different algorithms (features) are calculated by the system and each algorithm can be parametrized according to the quality needs for every exposure type used in the layer.
These algorithms are easy to explain. Based on physics, they correspond directly to process different phenomena.
- Absolute limits: Influences in the size and form of the cross section of one exposure like focal position, laser power and welding speed
- Signal dynamics: Noisy processes or less process dynamics like pollution, protective gas flow and lack of fusion
- Short time fluctuations: Short changes in the signal caused by e.g. ejects and pollution
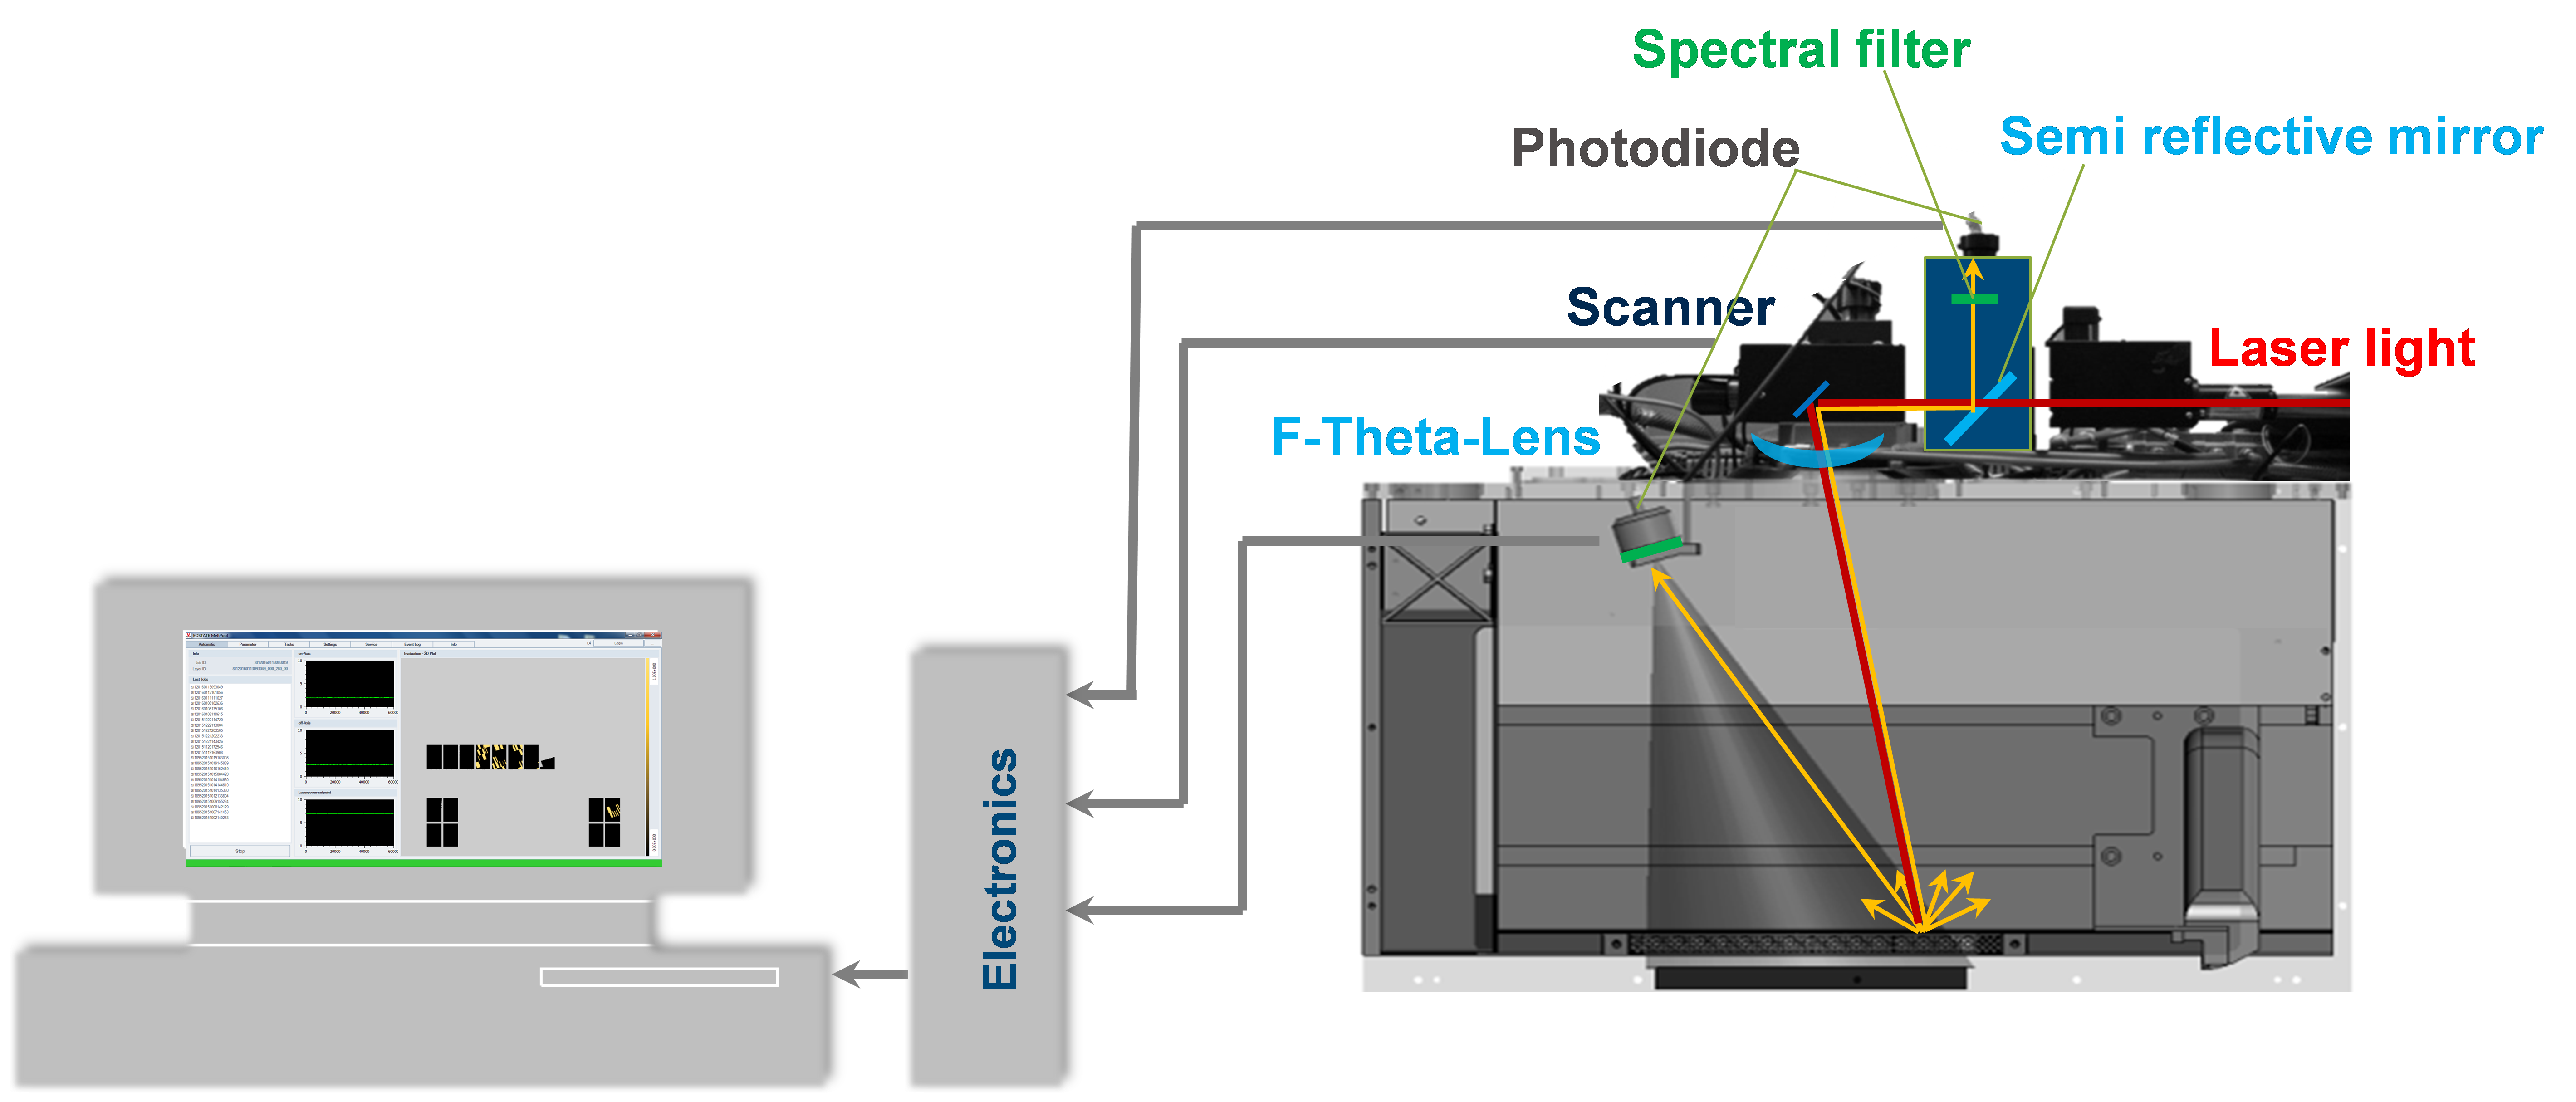
In cooperation with EOS, the described system was integrated with their machines. A typical layout is shown in Fig. 4.
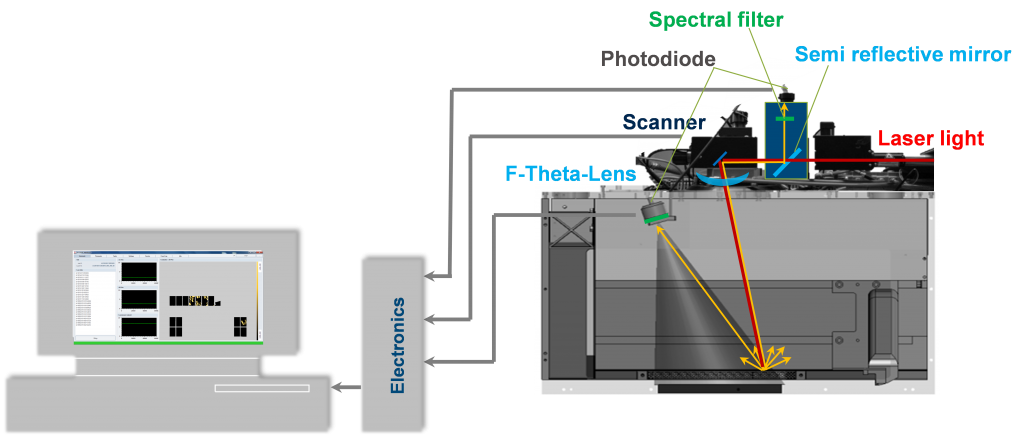
Fig. 4: System layout – EOSTATE Meltpool
As shown in Fig. 4, two total photodiodes are used an onAxis diode measuring the process emissions at the interaction zone of the laser beam and powder and an offAxis diode giving an overview of process emissions about the complete building platform.
A heuristic model is used for setting up the system; therefore, input parameters like process parameters (laser power, scanning speed, gas flow, …) and malfunctions like loss of laser power, and material quality are varied for different building jobs. The output parameters are part properties (porosity, surface roughness, …), process emissions (brightness, temporal behavior, spectral properties, …) and undesired effects like overheating, warpage and lack of fusion. Based on this data set the system can be parametrized to fulfill the quality needs of the customer.
Fig. 5 shows a provoked malfunction, missing powder choosing a too low dosing factor of powder, the irregularities (here red in Fig. 5) can be easily detected.
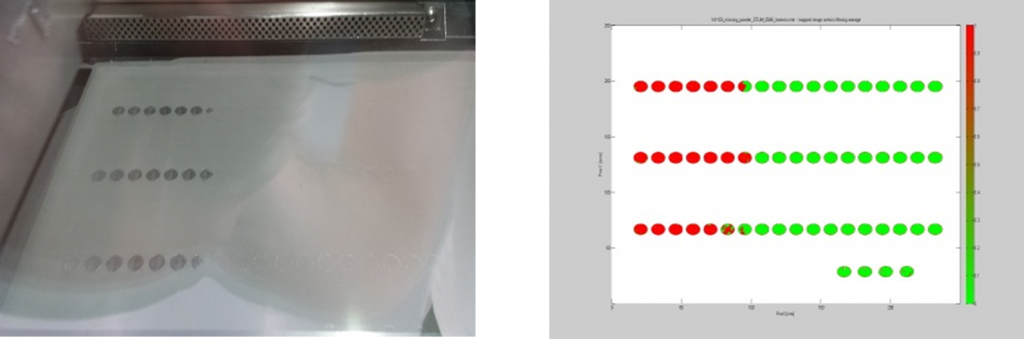
Fig. 5: Example missing powder, left image of powder bed, right calculated irregularities after exposure
Fig. 6 shows a phenomena process flipping provoked by changing the focal position, the irregularities (red in Fig. 6) can be detected successfully for the complete parts and also the embedded parts (letter F).
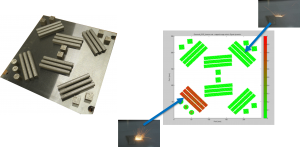
Fig. 6: Example process flipping, left image of building platform after complete build, right calculated irregularities
Successful detection of additional phenomena has been shown:
- Overhanging parts
- Dust/particles
- Part overlap
- Balling / humping
- SLI pores (simulated porosity)
- To be continued.
The presented diode based meltpool monitoring system enables the fully automated detection of process phenomena (see Fig. 7) which directly corresponds to part properties.
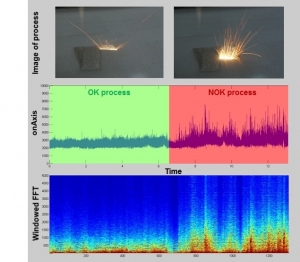
Fig. 7: Example stable and unstable process, top image of process emissions, middle measured brightness, bottom windowed FFT analysis
Easily understandable algorithms based on physics are applied and can be parametrized by the user according to its needs. A heuristic model for setting up limits was presented and examples of detectable process phenomena are given. The system is part of an integrated quality inspection portfolio at EOS including EOSTATE powderbed and EOSTATE system monitoring.
Further investigations in detectable process phenomena and self-healing effects of defects will be completed. Additional work is in progress in the field of statistical data processing, so information (see Fig. 8, e.g. trends, …) is extracted from data visualized in dashboards enabling the user to perform statistical process control (SPC) at one machine up to different machines at different locations worldwide.
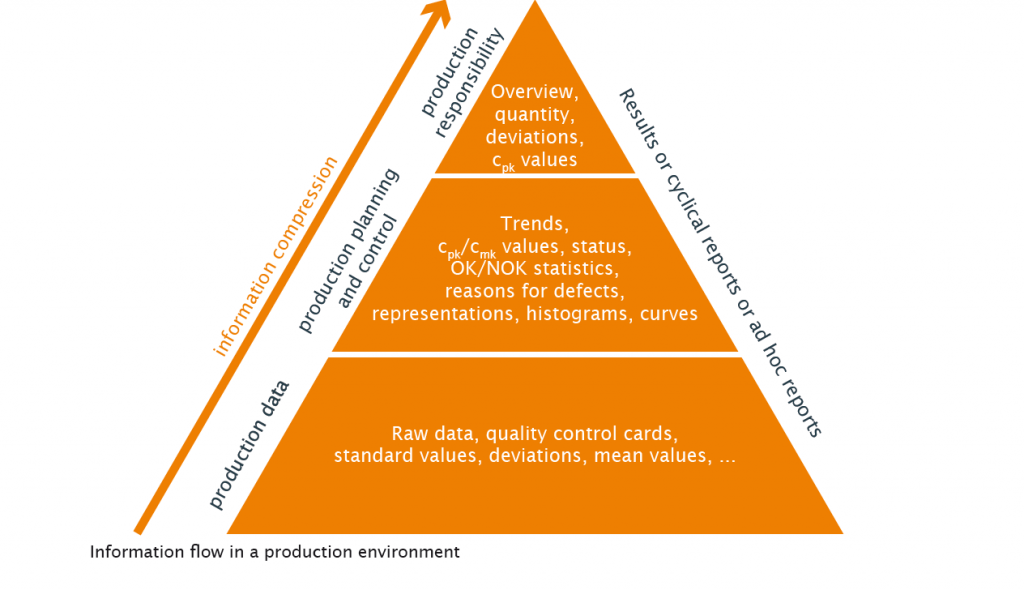
Fig. 8: Statistical process control
About plasmo
Headquartered in Vienna, Austria, plasmo is an innovative, globally operating technology company for automated quality assurance systems in manufacturing industries. Established in 2003, plasmo leads the way in the real-time quality control of joining processes. The extensive portfolio in the field of quality assurance includes laser power measurement, the monitoring of welding processes, geometric shapes and surfaces, tailor-made solutions in the field of industrial image processing, analysis software as well as an extensive range of services.
With over 700 plasmo systems in operation worldwide, the growing list of clients includes ABB, Benteler, BorgWarner, Faurecia, INA, SMS Siemag, Hettich, JCI, Magna and Valeo to Webasto, and numerous automobile manufacturers such as Audi, BMW, Daimler, Ford, GM, PSA, Suzuki, Volvo as well as various international steel manufacturers. www.plasmo-us.com
© 2017 Dr. Thomas Grünberger, plasmo Industrietechnik GmbH, Vienna